
If you find this article useful then please consider making a donation. It will be appreciated however big or small it might be and will encourage Brian to continue researching and writing about interesting subjects in the future.
It's a (possibly unfortunate) fact of life that when we write software applications, we need to debug them. Delphi's integrated debugger is usually quite helpful in tracking down many logic problems. Indeed Delphi's debugger sports more advanced features than most, particularly with the enhancements made in Delphi 5. These advanced features tend to make it no longer necessary for anyone to need to resort to the standalone Turbo Debugger, which probably explains why Turbo Debugger has not been actively developed for several years now.
However, even with the most advanced debugger at your disposal, it doesn't guarantee that it will be a straightforward task to rid your program of bugs. Indeed many developers often stare at the Delphi IDE, frowning and grinding teeth, struggling to get to the bottom of some obscure, unexpected behaviour in their application.
This paper looks at some handy debugging techniques that might help you in your task of flushing errors out of your program. Some of these will directly involve the debugger but many of them won't. The hope is to add to your debugging repertoire in order to assist your personal debugging quests when things go strangely wrong.
Of course I understand there are many third party tools in the marketplace that can also help tracking down problems, but this paper will be looking at options that involve using no external commercial tools, and so require spending no more money.
This paper focuses specifically on techniques for execution tracing and also for examining memory consumption as an aid to spotting memory leaks,
You can download the files that accompany this paper by clicking here.
A common debugging technique employed the world over is sometimes referred to as Poor Man's Debugging (we'll call it Poor Person's Debugging though, for the sake of political correctness). This involves peppering the program logic with calls to ShowMessage (or equivalent) to indicate progress through the application, or through a part of the application that is causing concern.
This is a low-tech direct option, but gives immediate feedback and allows you to simply track your application's passage through the appropriate sections and observe its progress. One major drawback of this approach to execution tracing is that once the tracing is done, it is necessary to go through the application source code removing the calls to this message routine, and ensuring you get every one of them.
Of course you could help this particular issue by surrounding your tracing calls with conditional compilation blocks, such as in Listing 1. You can then get the code to be compiled into the application or not, depending on whether you define the TRACE conditional define. Given this code may be anywhere in the application, this is best done by either adding or removing TRACE from the semicolon-separated list of conditional defines on the Directories/Conditionals page of the project options dialog.
Listing 1: Conditional tracing code
|
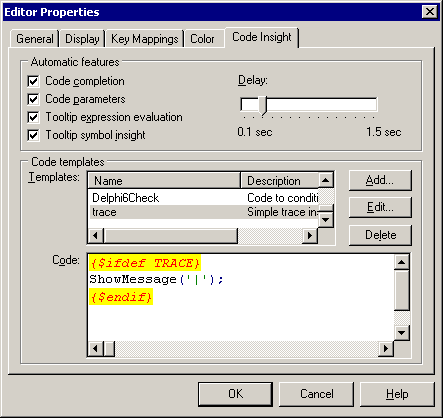
The apparent downside now is that you must enter three lines (or one quite long line if you like) for each trace instruction. This particular hurdle can also be removed by defining a new Code Template, dedicated to a trace instruction. The Code Insight page of the Tools | Editor Options... dialog allows you to add to the standard set of Code Templates with the Add... button.
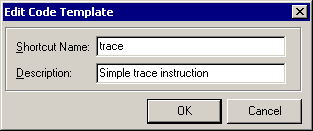
Figure 1 shows the dialog produced by the button, and sample values you can enter. Figure 2 shows how you can then set up the basic trace instruction template and uses the pipe sign between the quotes to dictate where the input cursor will be left after the Code Template has been entered (in-between the quotes).
Figure 1: Adding a new Code Template
Figure 2: Defining the new Code Template
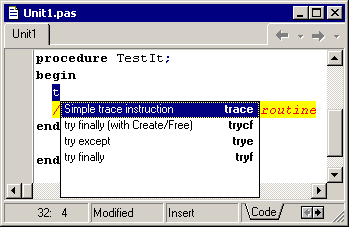
After pressing OK, it is ready for use. Any time you need a trace instruction, just press Ctrl+J in the editor and the full list will come up. To save on the time it takes to scroll through the list, you can alternatively enter any number of characters from the Code Template's name, then press Ctrl+J. Figure 3 shows what you get if you enter the first letter; you get just a few of them listed. If you enter enough characters to make it unambiguous (entering "tra" in this case would do it) means the Code Template is entered automatically, without displaying a list.
Figure 3: A short list of Code Templates
Code Templates were introduced in Delphi 3, however there are still surprising numbers of Delphi developers who do not take advantage of them for any snippets of code they regularly need to enter.
After all this, we are left with a quick way of getting a trace instruction in the program, and an easy way of removing all of them from the compiled executable.
When you trace through a program with ShowMessage there is not much option for logging the information. Each call results in a dialog that needs to be dismissed before you can proceed any further. It might be an idea to consider the logging aspect of the trace process. In nontrivial applications the results of the trace requests may need to be recorded in some fashion for later analysis and calls to ShowMessage fall down on this point (and others besides).
We will look at a few different ways of requesting trace instructions as this paper progresses, but before we go anywhere we should consider this business of trace logging; can we do better than a message box (which does nothing in this regard)? (By the way, the answer to that question is yes).
ShowMessage has several things stacked against it as a productive way of execution tracing. Firstly it provides no logging, which rules it out of the logging area. However there are other valid reasons not to use ShowMessage.
The dialog can potentially act intrusively on some types of application. If your application does custom drawing of any part of the UI, then the message box's appearance on the screen and subsequent disappearance may well cause that code to re-execute.
This may itself not be too much of a problem, but without the message box these invocations would not occur, and so the program inherently acts differently. Of course if the trace instructions are used in key drawing areas (such as an OnPaint event handler or a WM_SETFOCUS message handler), you are likely to walk into recursion problems.
Additionally, lots of trace requests requires lots of pressing of the message box's OK button, which may become tiresome or at least time-consuming.
An alternative to a message box would be a call to OutputDebugString. This Win32 API sends its text parameter to the application's debugger. The Delphi IDE displays these messages in its Event Log window, assuming the option is enabled.
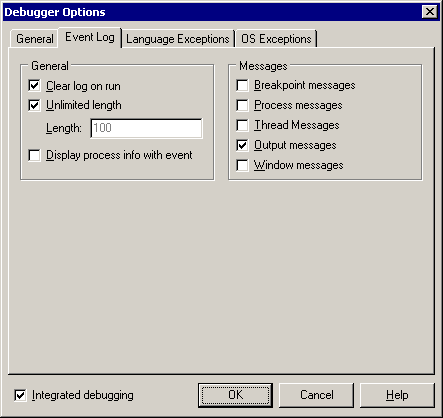
The Event Log, which was introduced in Delphi 4 can be accessed using View | Debug Windows | Event Log. You can customise it by right-clicking on it and choosing Properties or by going to the Event Log page of the debugger options dialog (Tools | Debugger Options...). My setup is shown in Figure 4 where you can see the Output messages option is checked, which ensures the text passed to OutputDebugString will be displayed.
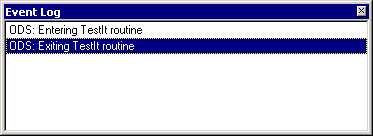
Listing 2 shows a sample routine using OutputDebugString and of course you can set up a Code Template that simplifies entering these calls, including conditional compilation if needed. You can see Delphi's Event Log after calling this code in Figure 5. Note that you can save the contents of the Event Log to a file from its context menu.
Listing 2: Using debug strings for trace messages
|
Figure 5: The event log showing debug messages
Passing literals is straightforward, but when you have a string expression to pass, the fact that OutputDebugString expects a PChar parameter can be a bit of a pain. Consequently it is common to write wrapper routines to make the trace calls more flexible, such as the overloaded versions of DebugMsg in Listing 3. These can be found in the DebugSupport.pas unit that accompanies this paper. Notice that they optionally add process ID and thread ID information into the debug string, through the MakeDebugMsg routine.
Listing 3: Wrapper debug string routines
|
When calling wrapper routines such as DebugMsg you should take care if you are trying to track execution through code that interacts at a very low-level with the memory manager. As it stands the routine calls Format and involves the allocation of temporary Delphi strings.
If, for example, you were tracing a new memory manager then this would doubtless cause recursion and the routines would need careful re-implementing to avoid internal memory allocations. For example you could try using short strings and turn them into PChars with StrPCopy. Also, you could declare some character array variable in the implementation section of the unit to avoid having to allocate memory for the PChars. Also the job of building formatted strings would need to be passed from Format to wvsprintf. Fortunately those types of situations are quite rare, but be warned!
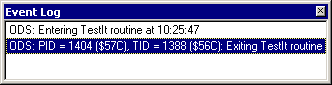
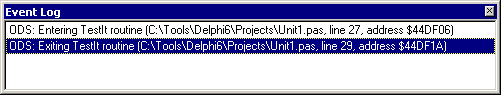
As the code stands, both versions of DebugMsg boil down to a call to InternalDebugMsg, which if necessary can be implemented in ways other than calling OutputDebugString. After the call to TestIt, Delphi's Event Log looks like Figure 6.
Figure 6: Debug messages with more information
The nice thing about OutputDebugString is that when the program is not running under a debugger, it does next to nothing. Passing a simple string to OutputDebugString takes about 0.0008 seconds on my 800MHz laptop when running under the debugger, but only a tenth of that when not.
If you are not too worried about having extra strings embedded in your executable, you don't even need to worry yourself about removing them (such as by using conditional compilation as described above). The resultant executable will be a little larger (because of the extra strings) but the performance should not be unduly hampered.
I understand that many developers have an adverse reaction to leaving debugging information in the deployed executable, but this would mean that you could do a little debugging on-site if necessary. All it requires is a tool that can display these debug messages. This can either be any appropriate debugger, even one you write yourself. Don't faint; it's quite easy to write a debugger that is only interested in catching debug messages using the available Win32 Debug API.
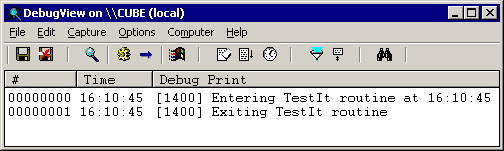
One example of a tool that can display debug messages from any application running alone (meaning not in a debugger) is DBMon.exe (the Debug Monitor for Windows NT/2000), which is one of Microsoft's Platform SDK Tools. There is also the freebie DebugView from www.sysinternals.com (for all 32-bit Windows platforms). DebugView optionally displays the time the message was sent and the process ID of the application that sent it along with the text of the message (see Figure 7).
One word of caution though: make sure you enable its Force Carriage Returns option otherwise it waits for a carriage return characters (actually line feeds, represented in Delphi as #10) before displaying any strings. Various tools expect a line feed terminator in debug strings including CodeWatch (part of SleuthQA Suite) and Memory Sleuth, both from TurboPower.
Figure 7: DebugView showing an application's debug strings
OutputDebugString will suffice as a means for logging trace requests for the time being, however Windows does offer other APIs.
You can investigate the NT Event Log, which has its own APIs for writing information to it. Windows 2000 and Windows .NET also offer another option called the Common Tracing API (sometimes referred to as the RAS tracing API). This API is also available in Windows NT 4 SP3 with the RRAS download installed.
Then on top of this, Microsoft have introduced a newer Event Tracing API (in Windows 2000 and later), which they advise to use instead of the Common Tracing API (but it is much more complex and involved).
Having found a better logging solution than ShowMessage, let's now change our attention to the mechanism by which we instigate the trace. Obviously we can always call the logging instruction directly but there are often ways of doing this indirectly which can be beneficial. Let's look at a couple of possibilities.
This topic will probably appear a little irrelevant for a while, but bear with me. You probably know that Delphi programs support Automation in that they can control Automation servers. There are two ways to achieve this: early bound Automation through COM interfaces and late-bound Automation through Variant variables.
This latter solution is rather clever if you think about it. You declare a Variant variable, assign it an appropriate value such as from a CreateOleObject call and then you can treat it like just an object, albeit without compile-time checks on the methods and properties you access. Listing 4 shows a simple example that automates Microsoft Word.
Listing 4: A sample of late-bound Automation
|
When you compile the program the compiler ensures all the information about methods called and parameters passed via Variant variables is packaged up into call descriptor records ready for the program to use at run-time. When the program runs, this information is accessed and passed through to the Automation server to get it to do what you want.
The compiler support of packaging up methods and properties into call descriptor records is always available, but the code that takes this information and passes it to the Automation server is not an inherent part of any Delphi application. In fact this only works if the ComObj unit is used in the project.
If you try simply calling a method through a Variant in a fresh application that doesn't use ComObj, you will get an EVariantError exception with a message saying: Variant method calls not supported. ComObj adds functionality to allow Automation to work.
Where this is leading is that if your application doesn't do any Automation, we can do something similar to ComObj in order to intercept these Variant method calls and perform some custom handling of them. For example, instead of implementing a full Variant method call dispatcher we can turn Variant method calls into custom trace instructions.
The way ComObj does its job is to assign an appropriate routine to an RTL pointer variable called VarDispProc. This is a pointer in the System unit in Delphi 2 to 5, but Delphi 6 moves it to the Variants unit and turns it into a procedural variable for clarity and type-strictness (see Listing 5).
Listing 5: The RTL Variant Automation hook
|
A simple example of this is shown in Listing 6. You call RerouteAutomation from the initialisation section of some unit (such as the RTLPatching unit that accompanies this paper). Any Variant method calls are then routed to the custom VarDispHandler routine, which does nothing other than take the first parameter passed (which is assumed to be a string) and pass it to DebugMsg.
Note that Delphi 6 Update Pack 2 makes some changes to Variant support which requires a Variant to have a VType field of varUnknown or varDispatch before this dispatch mechanism will be invoked (an runtime exception is generated otherwise). Because of this the RTLPatching unit declares a Variant variable called Msg in its interface section. This Variant can be used to invoke a trace instruction, and if Delphi 6 or later is being used, the underlying VType field is set appropriately.
Listing 6: A simple re-implementation of a Variant method call dispatcher
|
This then means you can use the Variant and call a trace method through it, for example:
|
This works okay, but does not really offer anything more than calling OutputDebugString directly, so let's take it a little further. Listing 7 shows a more adventurous implementation of the same routine. This time it examines all parameters passed to the method and builds a composite string out of textual representations of each one. It also takes into account named parameters (you can see two named parameters being passed to InsertDateTime in Listing 4) and embeds their names into the string as well.
Listing 7: A more interesting trace message generator
|
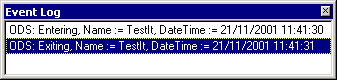
With this implementation, you can write trace messages like those in Listing 8 and they will show up in Delphi's Event Log as you can see in Figure 8.
Listing 8: More flexible trace messages
|
Figure 8: Trace messages built up from parts
Note again though that this approach is only valid if ComObj is not used in your application already to achieve Automation. You should remember that MIDAS/DataSnap applications tend to use ComObj (via the MConnect unit) as do applications that use ADO database connectivity (through the ADOInt unit).
As you can see from Listing 7, the code relies on a helper routine DispParamToVariant to do the donkey work of taking an arbitrary parameter at the other end of a pointer and make a Variant that contains the same value (see Listing 9). This solution gives the same basic effect as a direct call to OutputDebugString but is more flexible in that it can take any standard Automation-compatible parameters (in other words any parameter that can be stored in a Variant).
Listing 9: Turning a dispatch parameter into a Variant
|
Assertions are great one-line debug tools, introduced in Delphi 3. Wherever you generally expect a certain condition to be true you can use an assertion to ensure it. Listing 10 shows a call to an assertion that would appear before some code that operated on the assumption that I was not zero. The assertion evaluates the condition and raises an exception if it is not True.
Listing 10: Using an assertion
|
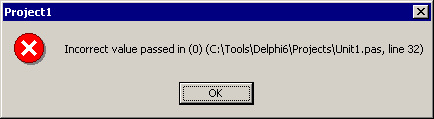
Listing 10 also shows the closest you can get to a similar effect using a normal condition and raising an exception. However, it is not the exact equivalent since assertions give you a little more information as you can see in Figure 9. Source file name and location and also line number information is provided, which is otherwise unavailable in a normal compiled Delphi application.
Figure 9: An assertion message at run-time
Assertions can be very useful in applications but many Delphi programmers do not use them. If you weren't aware of them before reading this paper, I suggest you look at whether they can be useful in your applications. However I would also like to illustrate that you can change their implementation, much as with the Automation approach, although with more benefits.
The default behaviour of an assertion in a GUI application is to evaluate the Boolean expression and raise an EAssertionFailed exception if so, with a message containing the error text, fully qualified source file name and line number.However, if you make a failed assertion in a console application that doesn't explicitly or implicitly use either the SysUtils or Forms units, you get different behaviour in the form of a message like: Runtime error 227 at 00401AFD. The program then terminates as runtime errors (RTEs) are terminal; RTE 227 is how an assertion manifests itself with just the basic RTL (the System unit) in place (the Variant method call exception from earlier is represented as RTE 222 in an application that does not use SysUtils or Forms).
The point of that apparent side-track was to emphasise that assertions can behave differently. By using SysUtils, a failed assertion changes from a fatal RTE to a recoverable exception. This is thanks to the SysUtils unit initialisation section redirecting the RTL variable AssertErrorProc to a custom routine.
Delphi 3, 4 and 5 define this as variable as a pointer in System.pas, but Delphi 6 uses a procedural variable as shown in Listing 11. All we need to do is define a routine that uses this signature, assign it to the variable and it will be called in place of the normal assertion code when the condition evaluates to False. This can also be done in the initialisation section of our unit, as long as we do not add our unit as the first unit in the project uses clause (thereby causing our initialisation section to execute before that of SysUtils).
Listing 11: The RTL assertion hook
|
Now what is all this in aid of? Well, if we replace the normal assertion behaviour with a trace instruction, such as OutputDebugString, we can use Assert to do tracing for us. The great thing about assertions is that every single one of them can be stripped from the executable (including all the assertion messages, and source file and line number strings) incredibly easily. Just toggle the Assertions option on the project options dialog's Compiler page and rebuild the project (note you must build, rather than compile, to ensure all source files are recompiled with the changed compiler option.
Listing 12 shows some code that uses Assert to trace passage through a sample routine, and also shows the code that re-implements Assert from the DebugSupport unit. When the program is run from Delphi the Event Log catches the more informative messages (see Figure 10).
Listing 12: Re-routing assertions
|
Figure 10: More informative trace messages
The fact that this form of tracing tells you the source file and line number (and even the address) of the Assert call, and also that all Assert calls can be readily stripped from the executable makes this my favourite tracing approach, although using it precludes using Assert for its normal purpose.
One major flaw in this plan for Delphi 3 users is that a bug in the implementation of assertions causes the program to still raise EAssertionFailed if you do not raise an exception in your replacement routine. This means you can only use re-implemented assertions for tracing (which really relies on not generating exceptions) in Delphi 4 and later.
With regard to the source that accompanies this paper, the RTLPatching.pas unit contains all the code for hooking assertions and Automation. Conditional compilation directives (using the HookAssertions and HookAutomation conditional symbols) allow you to choose which hooks are compiled in to any executable that uses the unit.
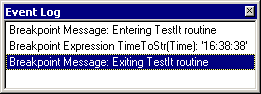
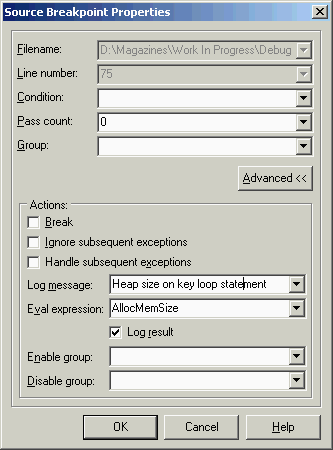
If you decide that you must not embed any debug support into your deployed executables, another option is to use the advanced breakpoint properties, introduced in Delphi 5. The normal purpose of a breakpoint is to halt execution of the program when the execution point meets the breakpoint (possibly in combination with a condition or a pass count) and pass control to the debugger.
From Delphi 5, a breakpoint doesn't actually have to break to the debugger. You can specify that the breakpoint does not break and also that it logs a message in the Event Log. On top of that you can specify an expression to evaluate, whose value is then optionally written to the Event Log. There are other options too that I am sure we will come back to in the future. For now, check out what the online help has to say about them.
To set up these advanced properties, you need to get to the normal breakpoint properties and press the Advanced >> button to expand it. Breakpoint properties can be viewed by either right-clicking on a breakpoint symbol in the editor's gutter and choosing Breakpoint properties... or by right-clicking on the appropriate breakpoint in the Breakpoint window (View | Debug Windows | Breakpoints) and choosing Properties.
Figure 11 shows the expanded dialog with properties that give similar information to the first trace statement in Listing 3. Or at least that is the intention.
Figure 11: Setting advanced breakpoint options
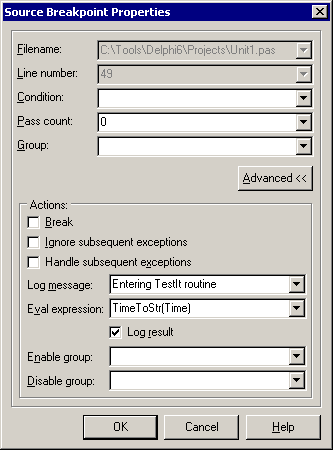
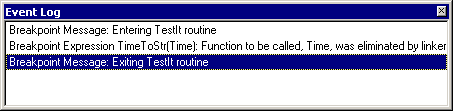
You can see that the call to TimeToStr(Time) is to be evaluated when the breakpoint is hit. However, this can only be done if it is definitely compiled into the executable. If there are no calls to either of these routines in the program you don't get the desired result (see Figure 12).
Figure 12: An unfortunate occurrence
To fix this little niggle, any functions you are likely to want to call in breakpoint evaluations should be called in the initialisation section of some handy unit to force the linker to include them. I added calls to TimeToStr and Time to the DebugSupport unit and got the better result shown in Figure 13.
Figure 13: A better result with advanced breakpoints
The good thing about these breakpoints is that they get saved with your project desktop (unlike editor bookmarks, for example) meaning they will be there every time you load up the project, until you remove them. But by the same token, they cause no debug code to be compiled into any of your executables. So ensure you have the Project desktop option checked in the Autosave options group on the environment options dialog's Preferences page.
When you write applications, sometimes you make mistakes which cause your application's memory consumption to rise unnecessarily. In the cases where this happens continuously applications will (eventually) use up all available memory making Windows grind to a halt.
It can sometimes be difficult honing in on these problems but it can also be tricky observing there is a problem in the first place. The following techniques show how you can monitor the memory consumption in your applications at run-time. This enables you to get a general indication of whether there is an issue of rising heap usage. This will tend to indicate that there is an issue that warrants investigation, but it can also help isolate the general application area where things are happening.
If you start the IDE with the -hm and -hv command-line switches, the main IDE window reports information on its own heap consumption. You can see this on its caption bar in Figure 14.
Figure 14: The Delphi IDE's heap consumption
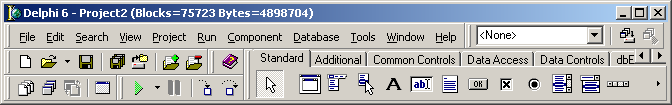
The -hm (Heap Monitor) switch is responsible for the information you can see being displayed; the number of allocated blocks in the heap and the corresponding number of bytes this equates to. As you perform various normal tasks in the IDE you will see these figures rise and fall, reflecting the allocations and deallocations (such as component and form creation) going on behind the scenes.
The -hv (Heap Validation) switch instigates a regular heap check behind the scenes. If any issues are found with the integrity of the heap data structures this indicates some form of heap corruption and is reported by a different suffix to the normal main window caption. Instead of the blocks and bytes being reported, you see a message like: (**Invalid Heap** code 4).
Both these facilities are designed to give the Delphi user an indication as to when things might be going wrong internally. They aren't really trying to tell you what is wrong, only that there is a problem, either excessive heap usage or heap corruption. If you see the heap usage rising continually and not coming back down, or you see an invalid heap code it tells you that you should close Delphi and start a fresh copy.
As an example of this kind of problem, Delphi 6 introduces a new Internet toolbar, which is not displayed by default. If you display it by right-clicking any visible toolbar (not the Component Palette) and choosing the Internet item you can easily see a heap leak problem. Just view the project source of any project you like and the IDE starts consuming memory in an ongoing manner. Indeed if you move the mouse over the IDE the memory consumption speeds up.
The problem (which is still present in Update Pack 2) is caused by the action object behind one of the Internet toolbar buttons. Its OnUpdate event handler is executed during each IDE idle cycle (when it's finished processing messages). This occurs normally after each internal timer tick event has finished being processed, but occurs more rapidly as you move the mouse as many mouse messages are being processed. The OnUpdate event handler seems to be allocating memory in some way and then neglecting to free it.
We can get the same kind of reporting behaviour in our own applications if we look hard enough in the RTL (run-time library), particularly the System unit.
When displaying memory consumption the IDE is making use of two System unit variables: AllocMemCount and AllocMemSize. These variables are maintained by the memory manager used by default by all Delphi applications. This memory manager allocates memory from the heap in large blocks and carves those blocks into appropriately sized chunks that are returned when memory is requested through the RTL routines. When memory is freed the memory manager adds freed blocks to lists it maintains for later usage.
This suballocation scheme is employed because the Windows heap allocation routines are not optimised for allocating lots of small memory blocks (as typically requested by Delphi applications), but more for larger blocks. This extra layer is implemented by Delphi code compiled into the System unit (but implemented in the GetMem.inc include file).
You can drop a timer on your main form with its Interval property set to a low value to initiate rapid execution of its OnTimer event, whose handler can read these values and add them onto the main form's caption. The timer's Enabled property should be set to False and should only be enabled (by the form's OnCreate handler) if the corresponding command-line switch is used. An example of this type of code is shown in Listing 13 and can be found in the MemoryConsumptionDemo.dpr project that accompanies this paper. Notice that AllocMemSize and AllocMemCount are read first and stored in variables to ensure the memory consumption reported does not include the extra allocations made by Format making temporary strings.
Listing 13: Displaying current memory statistics
|
As memory is used and freed in your application you will see the values rise and fall (assuming you passed it a -hm or /hm command-line switch). As an example, let's make a simple application that can dynamically create and destroy edit controls. The application needs two buttons and a panel. The first button creates an edit control and places it randomly on the panel, whilst the second button randomly destroys one of them, as shown in Listing 14.
Listing 14: Dynamically creating and destroying edit controls
|
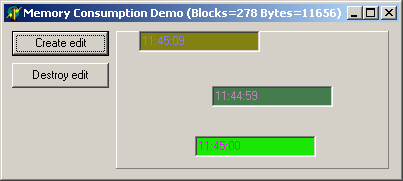
When the application is executed you will see that the first edit control causes nine blocks of heap to be consumed and that each successive one occupies five blocks. Figure 15 shows the form after two edits are created and Figure 16 shows it after three.
Figure 15: After two edits are created
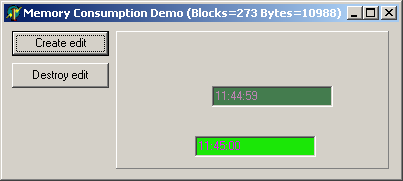
Figure 16: After a third edit has been created
You should note that the initial memory state before creating any edits is not quite the same as that when you destroy all the edits. This is due to the VCL caching various objects, such as fonts, pens, brushes and so on for more efficient use next time they are required. Because of this, you cannot use the figures as an exact means for spotting a leak. Instead you must look at the trends; if the memory consistently goes up further than it comes down as you repeat certain tasks, then that suggests some form of heap leak.
So far we have dealt with replicating the IDE's heap monitor option, but what about the heap validation? This can also be replicated by calling the GetHeapStatus routine. This returns a THeapStatus record with a variety of information about the application's heap usage, but for the current goal only the HeapErrorCode field is important. If this is zero then all is okay otherwise a problem has been observed.
You can incorporate this in the timer's event handler as shown in Listing 15. Notice an exception handler has been added to cater for cases where the heap is so bad that GetHeapStatus causes an Access Violation or other error. Also note that the single -hm switch controls both heap monitoring and heap validation in this example, for simplicity.
Listing 15: Heap monitoring and heap validation
|
As well as being used for display purposes at run-time you should remember that you can keep a watch on AllocMemCount and AllocMemSize in the debugger. As you step through statements you will be able to see the values go up and down, but in more discrete steps. Indeed you will be able to see how much memory is allocated or deallocated (directly and indirectly) on a statement by statement basis if needs be.
Another plan would be to use one of the advanced breakpoint features to get the same kind of information. For example if you need to verify whether memory was being leaked in a loop in your program you can place a breakpoint on the first statement in the loop. The advanced breakpoint properties can be used to stop the breakpoint breaking and get it to log the value of AllocMemSize instead (see Figure 17). Every time the breakpoint is hit another entry will be added to the debugger's Event Log, which can be examined whenever you like (and can also be saved).
Figure 17: A logging breakpoint
This next technique is not for the faint-hearted. It involves implementing a new memory manager and installing it in place of the normal one (the suballocating memory manager) in order to track allocations, reallocations and deallocations.
This is actually not quite as tricky a job as it sounds because you normally still use the suballocator to do the actual memory management. Your memory manager gets installed and any memory requests are forwarded along to the suballocator as usual, but your code can then record any details about the calls (such as the size of the memory block) for future cross-referencing.
This is exactly what memory tracking tools such as MemProof, Memory Sleuth and CodeWatch do. Every allocation, reallocation and deallocation is logged along with the call stack at that point. They then tend to use knowledge of the debugging information format to map memory calls to lines of source code. As any given block is freed, information about the allocation is thrown away as well. At the end of the run any memory blocks still unfreed are reported with source code references.
To illustrate the mechanisms for writing a chaining memory manager we'll implement one that does nothing too practical. Every allocation will cause a short noise to be made by the PC speaker at a pitch that relates to the size of the allocation (this feature won't work on Windows 95/98/Me due to the limited implementation of the Beep API on those platforms).
Listing 16: A replacement memory manager
|
The code can be seen in Listing 16 and involves setting up three routines (one for each type of memory request). The initialisation section of the unit records the details of the existing memory manager as installed by the System unit in the RTLMemMgr record. It then replaces it with the new memory manager using the typed constant NewMemMgr.
Each of the routines simply chains back to the original memory management routine but the allocation call also makes a beeping sound. A simple calculation raises the size of the requested memory block to a value that will be audible on a speaker.
If you add this unit to the project we have been working on you will find a long and varied sequence of noises coming out of your speaker before the program settles down. In fact even when the form appears on the screen you will still hear a constant, repeated pattern of noises due to the timer calling Format every tenth of a second if you pass the -hm switch.
Normally it is vital to ensure your new memory manager unit is in the project file's uses clause as the first unit to ensure that it gets installed before any memory allocations have taken place. It is also essential to not use any units that will cause allocations in their initialisation sections as that will occur before your memory manager is installed.
This prevents memory being allocated by one memory manager and then deallocated by another. However in this case we are deferring to the original memory manager anyway so it's not so important here.
In the cases where you do choose to be more adventurous you can get your unit to verify no memory has been allocated using an Assert statement in the initialisation section, as shown in Listing 17. However you will probably only get the specified text displayed if you running from the debugger with the Stop on Delphi Exceptions option enabled (the exception handling system may not be set up by the time that Assert is called).
Listing 17: Ensuring your memory manager has been used correctly
|
Also you must be careful not to do anything in your memory manager routines that will cause more allocations or deallocations to occur as that will instantly lead to recursion. One of countless examples that should be obvious by now is calling the Format routine. We saw earlier (or rather heard) that calls to Format involve a variety of memory allocations.
You could instead use an independent helper DLL that exported appropriate logging routines and ensure you just call these. So long as you don't use the ShareMem unit in the DLL and don't declare any parameters or return types as strings or dynamic arrays then the DLL can do as much allocating as it needs to record the information you have chosen to track.
If you are a user of Windows NT or Windows 2000 you will doubtless be familiar with the Task Manager and the information it displays about all running processes on its Processes page. Figure 18 shows our test application highlighted in the Task Manager and you can see that by default it displays a memory usage column.
Figure 18: The Task Manager showing memory information
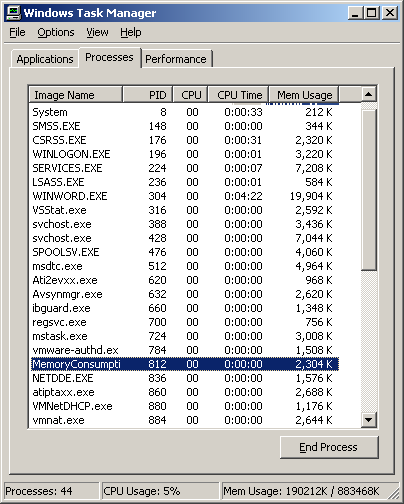
The values in this column equate to the application's working set, which equate to the amount of physical RAM currently allocated to the application for any use at all (it doesn't include space occupied in the paging file). Many developers like to keep an eye on their application's working set and this can be done programmatically.
The NT Task Manager can display lots more information, the choices being available in the dialog you get from View | Select Columns... menu item. Another useful value to display is the virtual memory size of your applications (which tells you how much of the paging file your application occupies). This can also be obtained programmatically.
The source of this information is an API in the PSAPI unit, an import unit for some routines available only on NT platforms. The GetProcessMemoryInfo routine fills a TProcessMemoryCounters record with information on various aspects of your application's memory consumption. The WorkingSetSize unsurprisingly returns the current size of your working set (PeakWorkingSetSize returns the largest it has been). PagefileUsage returns the value displayed by Task Manager as the virtual memory size (PeakPagefileUsage displays the maximum it has been).
All the information described in the API Help and Memory Usage And Validity sections can be displayed in an informational form that can be easily added to any project.
The sample project uses a unit called MemStatusForm.pas that implements a completely self-contained memory status form. The initialisation section creates an instance of the form, whose Visible property is set to True to ensure is immediately shows up. Other notable property values include FormStyle, which is fsStayOnTop to ensure the form can always be seen, and Align, which is set to alBottom to ensure the form sticks to the bottom of the Windows desktop.
The form has a number of labels and a timer on it. The timer ticks every quarter of a second and updates the labels with the statistics that have been covered so far. The code isn't particularly interesting, but can be seen in Listing 18. You can see that the most complex part of the logic is involved in formatting the information into strings for display by the labels.
Listing 18: The code behind the memory status form
|
The example application can be seen running with the memory status form in Figure 19, where a number of edit controls have been dynamically created. The Task Manager reports Mem Usage of 2,376 kb and a VM size of 744 kb. These figures are echoed on the memory status form along with more values that are more accurate (measured in bytes) and also less accurate (measured in megabytes).
Figure 19: The memory status form agreeing with the Task Manager
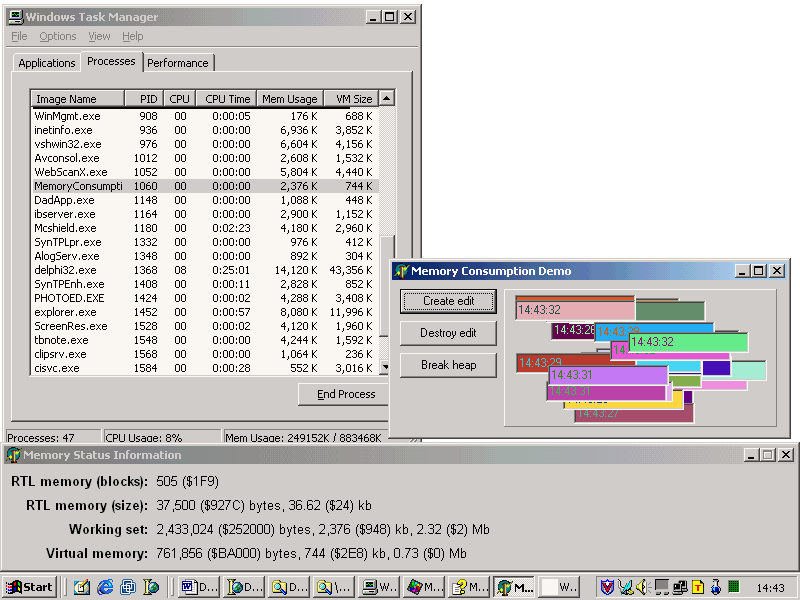
Again, this information is not discrete enough to tie down a problem to an exact cause but any of these tools can be used to help get an appreciation of your application's memory usage trends and help identify if there is a problem to start with.
There is more to simple execution tracing than you might think and in cases the results can be quite flexible as with the re-implemented Automation in conjunction with conditional compilation. You can also get more informative trace messages with re-implemented assertions, which don't require any conditional compilation to aid their removal when you are done with them. You can also use the same tracing code and plug in alternative implementations (in other words replace OutputDebugString with NT Event Log calls or calls to the Common Tracing API.
Memory tracking is not something only for commercial applications to uncover. The memory usage report mechanisms uncovered here will hopefully be useful in your debugging armoury the next time you need to verify if a heap leak exists or not.
Brian Long used to work at Borland UK, performing a number of duties including Technical Support on all the programming tools. Since leaving in 1995, Brian has spent the intervening years as a trainer, trouble-shooter and mentor focusing on the use of the C#, Delphi and C++ languages, and of the Win32 and .NET platforms. In his spare time Brian actively researches and employs strategies for the convenient identification, isolation and removal of malware. If you need training in these areas or need solutions to problems you have with them, please get in touch or visit Brian's Web site.
Brian authored a Borland Pascal problem-solving book in 1994 and occasionally acts as a Technical Editor for Wiley (previously Sybex); he was the Technical Editor for Mastering Delphi 7 and Mastering Delphi 2005 and also contributed a chapter to Delphi for .NET Developer Guide. Brian is a regular columnist in The Delphi Magazine and has had numerous articles published in Developer's Review, Computing, Delphi Developer's Journal and EXE Magazine. He was nominated for the Spirit of Delphi award in 2000.